avatar

AI小知识系列(四) Matplotlib常用操作

Matplotlib常用操作

1
2
import matplotlib.pyplot as plt
import numpy as np

1.折线图

1
2
3
4
5
6
7
8
9
10
11
12
13
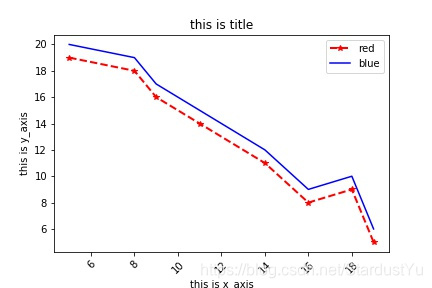
x_axis = [5,8,9,11,14,16,18,19]
y_axis1= [19,18,16,14,11,8,9,5]
y_axis2= [20,19,17,15,12,9,10,6]
plt.plot(x_axis,y_axis1, c = "r", label = "red")
plt.plot(x_axis,y_axis2, c = "b", label = "blue")
#美化图的操作
plt.xticks(rotation = 45) #使x轴的数字旋转45°
plt.xlabel("this is x_axis") #x轴标签
plt.ylabel("this is y_axis") #y轴标签
plt.title("this is title") #此图像的标题
plt.legend(loc = "best") #为图像生成legend,loc参数为best指,在最适合的地方显示

plt.show()

在这里插入图片描述

1
2
3
4
5
6
7
#plt.plot的常用参数如下
plt.plot(x_axis,y_axis1, c = "r", label = "red",linestyle='--',marker='*',linewidth=2)
#c---颜色参数,可选择'b'(蓝),'g'(绿),'r'(红),'c'(蓝绿),'m'(红),'y'(黄),'k'(黑),'w'(白)
#label---折线的标签,用作legend的显示
#linestyle---折现的样式,默认为None,可选择'-','--','-.',':'
#marker---点的样式,默认None,可选择'o'(圆) '.'(点) 'v'(下三角) '^' '*'(五角星) 'x'(叉号)等
#linewidth -- 线宽

在这里插入图片描述

2.保存绘制的图像

1
2
3
#保存图像
##在plt.plot运行后,使用plt.savefig,不能再plt.show之后再用,否则只能保存空图像
plt.savefig("examples.jpg")


3.matplotlib输出中文问题

1
2
3
4
from pylab import mpl

mpl.rcParams['font.sans-serif'] = ['FangSong'] # 指定默认字体
mpl.rcParams['axes.unicode_minus'] = False # 解决保存图像是负号'-'显示为方块的问题


4.绘图中的其他的操作

1
2
3
4
5
6
7
8
9
10
11
12
13
14
15
16
17
18
19
20
21
# 设置坐标轴的取值范围
plt.xlim((-1, 1))
plt.ylim((0, 2))

#设置刻度
##设置x坐标轴刻度, 原来为0.25, 修改后为0.5
plt.xticks(np.linspace(0, 20, 5))
##设置y坐标轴刻度及标签, $$是设置字体
plt.yticks([10, 15], ['$minimum$', 'normal'])

#关闭坐标轴的显示
plt.axis('off')

#legend的复杂操作
l1, =plt.plot(x_axis,y_axis1, c = "r", label = "red")
l2, =plt.plot(x_axis,y_axis2, c = "b", label = "blue")
plt.legend(handles = [l1, l2,], labels = ['red', 'blue'], loc = 'best')

#设置绘图风格
plt.style.available #查看可用的绘图风格
plt.style.use("bmh") #使用某一个名叫bmh的绘图风格


5.子图—subplot讲解

1
2
3
4
5
6
7
8
9
10
11
12
plt.subplot(2,1,1)  #构建一个2行1列的子图,此处在第一个子图进行绘制
plt.plot(x_axis,y_axis1, c = "r", label = "red")
plt.title("this is title") #此图像的标题
plt.legend(loc = "best") #为图像生成legend,loc参数为best指,在最适合的地方显示

plt.subplot(2,1,2) #此处在第二个子图进行绘制
plt.plot(x_axis,y_axis2, c = "b", label = "blue")
plt.xlabel("this is x_axis") #x轴标签
plt.legend(loc = "best") #为图像生成legend,loc参数为best指,在最适合的地方显示

plt.show()
#两幅图像采用不同的配置

在这里插入图片描述


6.条形图绘制

1
2
3
4
5
6
7
8
9
10
X = [1, 2, 3, 4, 5, 6] #每条bar的位置
Y1 = [2,3,6,1,7,8] #每条bar的高度值
plt.bar(X, Y1, label='blue')

plt.xlabel("this is x_axis") #x轴标签
plt.ylabel("this is y_axis") #y轴标签
plt.title("this is title") #此图像的标题
plt.legend(loc = "best") #为图像生成legend,loc参数为best指,在最适合的地方显示

plt.show()

在这里插入图片描述

1
2
3
4
5
6
7
plt.bar(X,Y1,alpha=0.5,width=0.8,color='b',edgecolor='r',label='blue',linewidth=3)
#alpha---透明度,1代表不透明,0代表全透明。
#width---柱子的宽度
#color---柱状图填充的颜色,可采取的颜色同上
#edgecolor---图形边缘的颜色,可采取的颜色同上
#label---图像的标签
#linewidth---边缘的宽度

在这里插入图片描述

1
2
plt.barh()  #横着来显示数据
plt.barh(X,Y1,alpha=0.5,width=0.8,color='b',edgecolor='r',label='blue',linewidth=3)

在这里插入图片描述

7.散点图的绘制

1
2
3
4
5
6
7
8
9
10
11
12
13
14
x_axis = [5,8,9,11,14,16,18,19]
y_axis1= [19,18,16,14,11,8,9,5]
y_axis2= [20,19,17,15,12,9,10,6]
plt.scatter(x_axis, y_axis1,color='r',label='red')
plt.scatter(x_axis, y_axis2,color='b',label='blue')

plt.xlabel("this is x_axis") #x轴标签
plt.ylabel("this is y_axis") #y轴标签
plt.title("this is title") #此图像的标题
plt.legend(loc = "best") #为图像生成legend,loc参数为best指,在最适合的地方显示

plt.show()

#plt.scatter的参数同plt.plot,不在赘述

在这里插入图片描述


8.直方图的绘制

1
2
3
4
#直方图用来统计数据出现的频率
Y=[1,1,2,2,2,3,3,4,4,4,4,5,5]
plt.hist(Y)
plt.show()

在这里插入图片描述

1
2
3
4
5
6
plt.hist(Y,alpha=0.8,facecolor='b')
#range---默认None,选择直方图显示的范围
#bins---指定我们显示的直方图的边界
#alpha---透明度
#facecolor---直方图颜色
#histtype---直方图类型,可选‘bar’, ‘barstacked’, ‘step’, ‘stepfilled’
1
2
3
4
5
6
7
8
9
10
11
#绘制直方图的高级操作---一次绘制多个
data = [np.random.randint(0, n, n) for n in [3000, 4000, 5000]]
labels = ['3K', '4K', '5K']
bins = [0, 100, 500, 1000, 2000, 3000, 4000, 5000]
#bins数组用来指定我们显示的直方图的边界,即:[0, 100) 会有一个数据点,[100, 500)会有一个数据点,以此类推。所以最终结果一共会显示7个数据点。同样的,我们指定了标签和图例。

plt.hist(data, bins=bins, label=labels,color=['r','g','b'])
plt.legend()

plt.show()
#此处引用 https://blog.csdn.net/hiudawn/article/details/80373996

在这里插入图片描述


9.盒图

1
2
3
Y=[1,1,2,2,2,3,3,4,4,4,4,5,5]
plt.boxplot(Y)
plt.show()

在这里插入图片描述


10.饼状图

1
2
3
4
5
6
7
8
9
labels = ['Mon', 'Tue', 'Wed', 'Thu', 'Fri', 'Sat', 'Sun']
data = [1, 2, 3, 4, 5, 6, 7]
plt.pie(data, labels=labels, autopct='%1.2f%%') # 第一个参数是占比,第二个各自的标签,第三个是显示精度

plt.axis('equal') #调整一下图
plt.legend(loc='best')

plt.show()
#此处引用 https://blog.csdn.net/hiudawn/article/details/80373996

在这里插入图片描述

1
2
3
4
5
6
7
8
9
plt.pie(data,labels=labels,explode=[0.1 for i in range(7)], startangle=90,shadow=True,autopct='%1.2f%%')
#lablels---每一块的标签
#explode---每一块离中心的距离
#startangle---起始绘制角度,默认图是从x轴正方向逆时针画起,如设定=90则从y轴正方向画起
#shadow---是否有阴影
#labeldistance---label绘制位置,相对于半径的比例, 如<1则绘制在饼图内侧
#autopct---显示精度
#pctdistance---类似于labeldistance,指定autopct的位置刻度
#radius---控制饼图的半径

在这里插入图片描述

文章作者: 白丁
文章链接: http://baidinghub.github.io/2020/04/03/AI%E5%B0%8F%E7%9F%A5%E8%AF%86%E7%B3%BB%E5%88%97(%E5%9B%9B)%20%20Matplotlib%E5%B8%B8%E7%94%A8%E6%93%8D%E4%BD%9C/
版权声明: 本博客所有文章除特别声明外,均采用 CC BY-NC-SA 4.0 许可协议。转载请注明来自 BaiDing's blog
打赏
  • 微信
    微信
  • 支付寶
    支付寶

评论